

Vox released an article on March 1st titled, “The Republican revolt against democracy, explained in 13 charts“. This article is a political explainer, which is a common style and format used by this publisher. The multiple data sets that were visualised through charts were used to illustrate the extent to which the Republican Party rejects democracy and if this issue is likely to get worse.
THE SIGNIFICANCE OF THE DATA
The data used clearly drives the story in this instance. Using charts to tell the story that are both simplistic and complicated to paint a vivid picture of how a political party can become so influential to attitudes towards democratic practices.
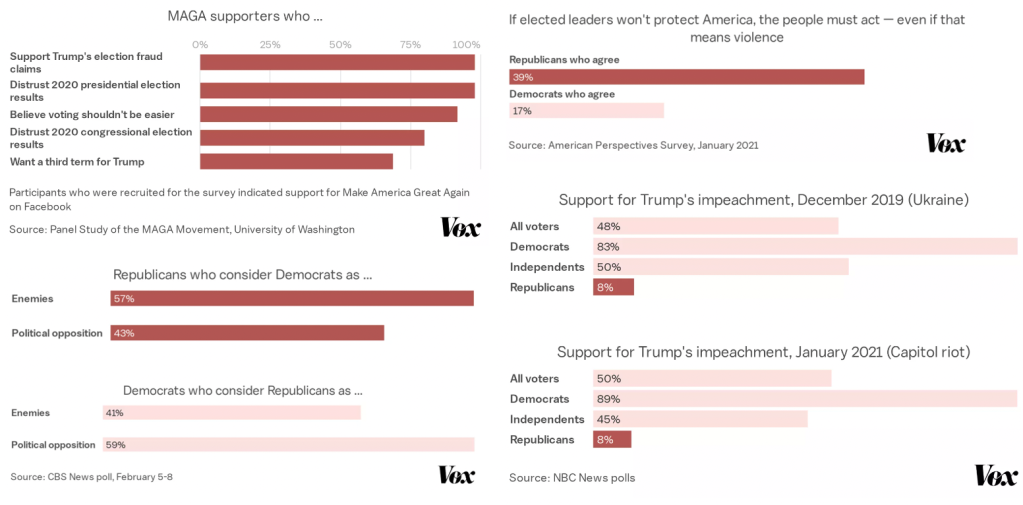
The article first uses the data to establish the current prevalence of anti-democratic ideas and hatred towards the democratic party beyond political rivalry. Data which is highlighted includes statistics such as, 70 percent of republicans would support a hypothetical third term for trump. This hypothetical, which is unconstitutional, is poignant and effective in concluding that a large percentage of republicans support anti-democratic practices.
The embracing of violence by republicans is also illuminated through data with “nearly two in five Republicans — said in a January poll that force could be justified against their opponents,”. This paired with the data that found that 57 percent of republicans consider democrats as enemies reflects the journalists conclusion that fear of losing when the risk is perceived to be high can lead to anti-democratic action. The January 6th Capitol Hill attack is used as an example of this data in action.
THE VISUALISATIONS
The visualisations and graphics were created by Tim Williams a Copy Editor for Vox who helps manage the Vox style guide as well as edit articles to establish clarity and accuracy. The visualisations when displayed as bar charts were all uniform in theme, colour, font and style. The colour red was used frequently which is symbolic of the Republican party, the primary focus of the article.
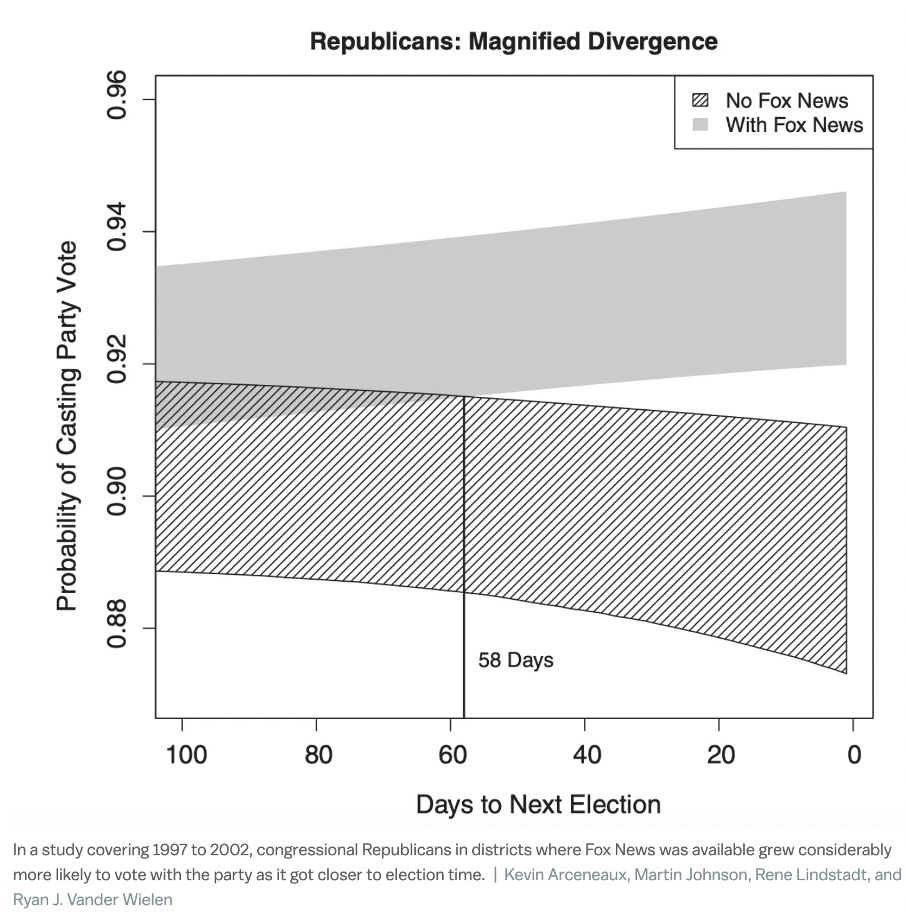
Divergence from this layout was when the charts were directly taken from research papers and original sources.

These charts were more difficult to comprehend compared to the more simplistic bar chart. The scatter plot chart displayed above is hard to read due to the size of the dots. The zoom in feature did not clarify the unlabelled dots it instead just enlarged the image. This made it difficult to understand all the data that is intended to be displayed in this chart.
The Vox article also makes reference to other parties such as Canada’s CPC and Germany’s CDU, these are not highlighted like the two red USA parties are. This makes it harder for readers to understand the intended reference and leaves them searching the chart longer than necessary.
The SOURCES
Though the data used comes from a litany of sources, university research papers and studies are what is predominantly used.
University sources include; University of Washington, Vanderbilt University and Yale University .
An example of an academic source used in the Vox article is this probability chart which was taken from a research paper by Kevin Arceneaux (Temple University), Martin Johnson (Louisiana State University), Renee Lindstadt (University of Essex) and Ryan J. Vander Wielen (Temple University).
Sources that were not taken from university studies and research include; the American Perspectives Survey January 2021, CBS News Poll, Pew Research Center Surveys, Morning Consult Poll and the Global Party’s Survey, which was a 2019 poll of nearly 2,000 political experts from around the world.
All university papers were hyper-linked in the article and the original data from all sources are accessible to the public allowing for further research into particular points that were made by the journalist. The sources also identified the date of the data sets, with the majority from 2019 to early 2021. This made the data more compelling due to its relevance to the publishing date of March 1st 2021.
The JournalisT

Source: Vox.com
Zack Beauchamp is a senior correspondent at Vox. He has experience in covering global politics and ideology. Mr. Beauchamp is also the host of Worldly, a Vox podcast on foreign policy and international relations.
His work focuses primarily on the rise of the populist right across the West, the role of identity in American politics, and how fringe ideologies shape the mainstream. A focus that is encapsulated in this article which depicts republican revolt against democracy.
